
During March and April, we had a number of performance issues that made Debusine’s core functions of running work requests and reflecting their results in workflows quite unreliable. Investigating and fixing this took up a lot of time from both the Debusine development team and Freexian’s sysadmins.
The central problems involved a series of database concurrency and worker communication issues that interacted in complex ways. On bad days, this caused between 10% and 25% of processed work requests to fail unnecessarily. We communicated some of the problems to users on IRC, but not consistently since we didn’t entirely understand the scope of the problems at the time.
Most of the problems are fixed now, but we had a retrospective meeting to make sure we understood what happened and that we learn from it. Here’s a summary.
Data model
Debusine’s workflows consist of many individual work requests. Each work request has a database row representing its state, which means that the overall state of a workflow is distributed across many rows. Changes to one work request (for example, when it is completed) can cause changes to other work requests (perhaps unblocking it so that it can be scheduled to an idle worker). Those changes may happen concurrently, and in practice often do.
Workers typically need to create artifacts containing the output of tasks: these include things like packages, build logs, and test output.
Debusine records task history so that it can make better decisions about how to schedule work requests. Since this might otherwise grow without bound, the server expires older parts of that history after a while. The same is true for many other kinds of data.
Causes
-
Because workflows involve changes that propagate between work requests, there were historically some cases where different parts of the system could deadlock due to trying to take update locks on overlapping sets of work request rows in different orders. We mitigated that somewhere around 2025-11-05 by locking entire workflows in one go before making any change that might need to propagate between work requests like this; that dealt with the deadlocks, but it’s quite a heavyweight locking strategy that sometimes caused significant delays.
-
We’ve been working for some time to make Debusine useful to Debian developers, and regression tracking is an important part of that: it lets developers test uploads without being too badly misled by tests in related packages that were already failing before they started. On 2026-03-11 we enabled this by default on debusine.debian.net, after testing it for a while. Although this is useful, it put more load on the system as a whole, often approximately doubling the number of work requests in a given workflow with many additional dependencies between them.
-
Like much of the world, we’re in an arms race with unethical scrapers desperately trying to feed everyone else’s data into LLMs before they run out of money. We saw a substantial uptick here towards the end of March, which meant that we had to temporarily disable regression tracking and to put some other mitigations in front of our web interface.
-
We historically haven’t had systematic internal timeouts. Prompted by ruff, a Google Summer of Code applicant went through and added timeouts in many places, including some calls between the worker and the server. This was fiddly work and the student did a solid job, so I’m not putting them on blast or anything! However, it did mean that some things that came in under load balancer timeouts now timed out earlier on the client side of the request (and hence in Debusine workers), which made some problems show up in different ways and be more obvious. This was deployed on 2026-04-03.
Fixes
Workflow orchestration
Figuring out what individual work requests need to be run as part of a workflow - the process we call “orchestration” - can be challenging. Unlike typical CI pipelines, these workflows often span substantial chunks of a distribution: a glibc update can involve retesting nearly everything! Nevertheless, it’s not particularly helpful for it to take hours just to build the workflow graph.
Fixing this involved many classic database optimizations such as adding indexes and CTEs, but probably the most effective fix was adding a cache for lookups within each orchestrator run or work request. Profiling showed that resolving lookups was a hot spot, and the way that task data is often passed down through a workflow meant that the same lookup could be resolved hundreds or thousands of times in a large workflow.
Expiry
We knew for quite some time that our expiry job took very aggressive locks, effectively blocking most of the rest of the system. This was an early decision to make the expiry logic simpler by allowing it to follow graphs without worrying about concurrent activity, but it clearly couldn’t stay that way forever.
Row locks in
PostgreSQL
was very helpful in figuring out the correct approach here. Since we’re
mainly concerned about the possibility of new foreign key references being
created to artifacts we’re considering for expiry, and since that would
involve taking FOR KEY SHARE locks on those rows, we can explicitly take
FOR UPDATE locks (which conflict with FOR KEY SHARE), and then recompute
the set of artifacts to expire with any locked artifacts marked to keep.
This was delicate work, but it saved minutes of downtime every day.
Whole-workflow locking
I mentioned earlier that we avoided some deadlock issues by taking locks on
entire workflows. To ensure that these locks are effective even against
code that isn’t specifically aware of them, this is implemented by using
SELECT FOR UPDATE on all the work request rows in the workflow. In some
cases the search for which rows to lock itself tripped up the PostgreSQL
planner.
Scheduling
We run multiple Celery workers for various purposes. Some of them can do many things in parallel, but in some specific cases (notably the task scheduler) we only ever want a single instance to run at once. Unfortunately a bug in the systemd service meant that the scheduler often ran concurrently anyway! Once we fixed that, the scheduler logs became a lot less confusing.
When Debusine was small, it was reasonable for it to perform scheduling very aggressively, typically as soon as any change occurred to a work request or a worker that might possibly influence it. This doesn’t scale very well, though, and even though we tried to batch multiple scheduling triggers that occurred within a single transaction, it could still make debugging very confusing. We reduced the number of changes that would result in immediate scheduling, and deferred everything else to a regular “tick”.
The scheduler may not be able to assign a work request to an idle worker due to the workflow being locked. That isn’t a major problem in itself; it can just try again later. However, in very large workflows, we found that it often worked its way down all the pending work requests one by one finding that each of them was locked, which was slow and also produced a huge amount of log noise. It now assumes that if a work request is locked, then it might as well skip other work requests in the same workflow until the next scheduler run.
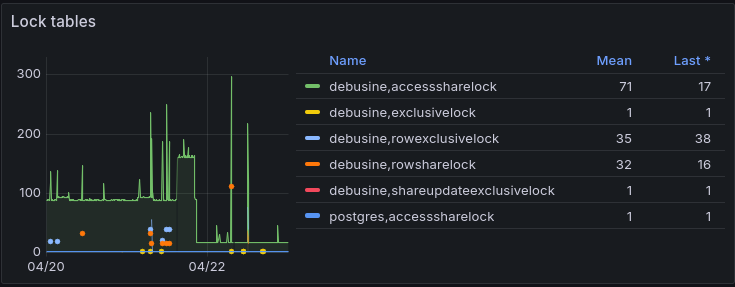
Between them, these changes reduced the number of locks typically being held on debusine.debian.net by about 80%:
Worker refactoring
The Debusine worker has always been partially asynchronous, but while it was actually executing a task - in other words, most of the time, at least in busy periods - it didn’t respond to inbound websocket messages, causing spurious disconnections. We restructured the whole worker to be fully event-based.
We also had to put quite a bit of effort into improving the path by which workers report work request completion, because if that hits a timeout then it can mean throwing away hours of work. We have some further improvements in mind, but for now we defer most of this work to a Celery task so that whole-workflow locks aren’t on the critical path.
Database write volume
One of our sysadmins observed that our database write volume was consistently very high. This was a puzzle, but for a long time we left that unexplored. Eventually we thought to ask PostgreSQL’s own statistics, and we found a surprise:
debusine=> SELECT relname AS table_name,
debusine->        n_tup_ins AS inserts,
debusine->        n_tup_upd AS updates,
debusine->        n_tup_del AS deletes,
debusine->        (n_tup_ins + n_tup_upd + n_tup_del) AS total_dml
debusine-> FROM pg_stat_user_tables
debusine-> WHERE (n_tup_ins + n_tup_upd + n_tup_del) > 0
debusine-> ORDER BY total_dml DESC
debusine-> LIMIT 20;
              table_name              | inserts |  updates   | deletes | total_dml
--------------------------------------+---------+------------+---------+------------
 db_collectionitem                    | 1418251 | 3578202388 | 3630143 | 3583250782
 db_token                             |   15143 |   11212106 |   11389 |   11238638
 db_workrequest                       |  386196 |    6399071 | 1820500 |    8605767
 db_fileinartifact                    | 2783021 |    1837929 | 1663887 |    6284837
 django_celery_results_taskresult     | 1819301 |    1501623 | 1791656 |    5112580
 db_artifact                          |  960077 |    3340859 |  663890 |    4964826
 db_collectionitemmatchconstraint     | 1550457 |          0 | 2207486 |    3757943
 db_artifactrelation                  | 2229382 |          0 | 1363825 |    3593207
 db_fileupload                        | 1023400 |    1057036 | 1023346 |    3103782
 db_file                              | 1673194 |          0 |  970252 |    2643446
 db_fileinstore                       | 1411995 |          0 |  970259 |    2382254
 db_filestore                         |       0 |    2381578 |       0 |    2381578
 django_session                       |  645423 |    1519880 |     531 |    2165834
 db_workrequest_dependencies          |  365877 |          0 |  936537 |    1302414
 db_worker                            |   18317 |     949280 |    9487 |     977084
 db_collection                        |   10061 |         85 |  177741 |     187887
 db_workerpooltaskexecutionstatistics |   28721 |          0 |       0 |      28721
 db_workerpoolstatistics              |    1640 |          0 |       0 |       1640
 db_workflowtemplate                  |     130 |        158 |     649 |        937
 db_identity                          |      76 |        661 |       0 |        737
(20 rows)
Oh my - that’s a lot of db_collectionitem updates and must surely be out
of proportion with what we really need. Can we narrow that down by asking
about the most recently-updated tuples?
debusine=> SELECT DISTINCT category
debusine-> FROM db_collectionitem
debusine-> WHERE id IN (
debusine->     SELECT id FROM db_collectionitem
debusine->     ORDER BY xmin::text::integer DESC LIMIT 10000
debusine-> );
           category
------------------------------
 debusine:historical-task-run
(1 row)
That might not be absolutely reliable, but it was certainly a hint. As per
PostgreSQL’s
documentation,
by default UPDATE always performs physical updates to every matching row
regardless of whether the data has changed, and our code to expire old task
history entries wasn’t doing that properly. Once we knew where to look, it
was easy to add some extra
constraints.
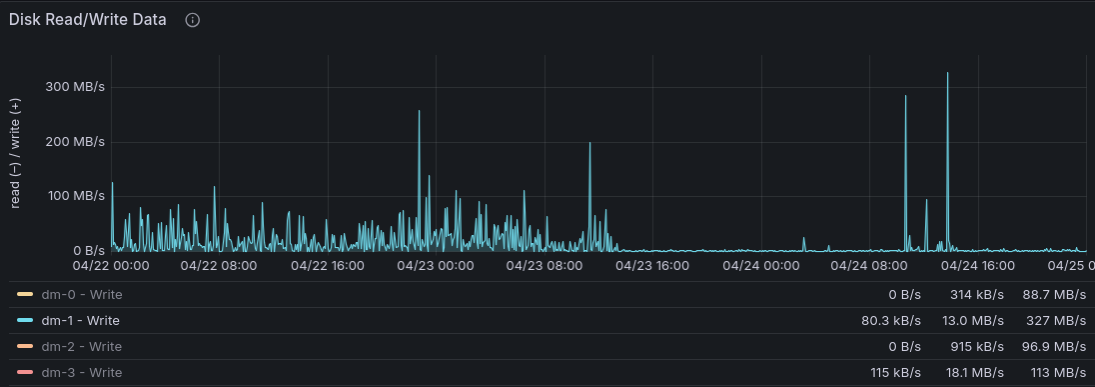
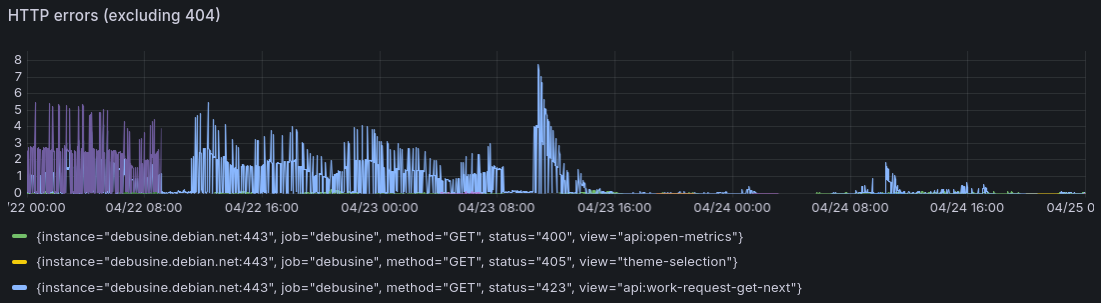
This reduced our mean write volume on debusine.debian.net from about 23 MB/s to about 3 MB/s, which had an immediate knock-on effect on our request failure rate:
Current state
Our metrics indicate that things are a lot better now. We still have a few things to deal with, such as:
- Some more performance fixes are on their way to fix some remaining cases where views are very slow or where file uploads from workers fail due to locks.
- We have some changes in the works to revamp how work request changes propagate through workflows in a way that doesn’t require so many heavyweight locks.
- We have a number of monitoring and alerting improvements we’d like to
make, both for outcomes (things like slow Celery tasks) and possible root
causes (database performance). We’d also like to deploy some more modern
observability tools; hunting for things using
journalctlisn’t terrible, but it’s not really the state of the art. - We need to improve how we communicate to users when we’re having operational problems, both informally (IRC, etc.) and on the site.
- Retries don’t always behave the way you’d expect in workflows.
I hope this has been an interesting tour through the sorts of things that can go wrong in this kind of distributed system!